"I have had my results for a long time, but I do not yet know how I am to arrive at them."
- Carl Gauss
W.D. Gann
|
Synopsis
William Delbert Gann (W.D. Gann, June 6, 1878 - June 18, 1955), attained legendary status as a market operator on Wall Street between 1900 and 1956. In 1902, Gann began trading the stock and commodity markets. As his success trading career on Wall Street progressed, so did his followers. He began to publish his “Supply & Demand” forecasts for stocks and commodities and demonstrated an uncanny ability to forecast major market turning points. As a student of the markets and human nature, he committed his life to gaining an understanding of what lay behind market movements. This pursuit led him to develop several theories that had their basis in mathematics. Source: Gann Global Financial
| ||
W.D. Gann Interview by Richard D. Wyckoff (1909)
W.D. Gann believed that time was the most important factor in forecasting market movement. He felt that the future is a repetition of the past, and each market movement is working out time in relation to a previous time cycle. Gann wrote that in a rally cycle, when a price declines under an angle, price will often dip down to the next angle before finding support. These support and resistance angle lines are different from today's support and resistance trend-lines because the angle lines can be used to indicate time.
W.D. Gann's Law of Vibration is the intellectual basis for his Square of 9 principle and most of his work. In 1909, it appeared that W, D. Gann developed an entirely new idea as to the principles governing stock market movements. Gann was viewed as a Wall Street's new man with a new idea, an idea which violates the traditions and encourages a scientific view of the Proposition, is not usually welcomed by the majority, for the reason that he stimulates thought and research.
W.D. Gann's Law of Vibration is the intellectual basis for his Square of 9 principle and most of his work. In 1909, it appeared that W, D. Gann developed an entirely new idea as to the principles governing stock market movements. Gann was viewed as a Wall Street's new man with a new idea, an idea which violates the traditions and encourages a scientific view of the Proposition, is not usually welcomed by the majority, for the reason that he stimulates thought and research.

W. D. Gann's description of his experience and methods is given herewith:
"For the past ten years I have devoted my entire time and attention to the speculative markets. Like many others, I lost thousands of dollars and experienced the usual ups and downs incidental to the novice who enters the market without preparatory knowledge of the subject."
"I soon began to realize that all successful men, whether Lawyers, Doctors or Scientists, devoted years of time to the study and investigation of their particular pursuit or profession before attempting to make any money out of it."
"Being in the Brokerage business myself and handling large accounts, I had opportunities seldom afforded the ordinary man for studying the cause of success and failure in the speculations of others. I found that over ninety percent of the traders who go into the market without knowledge or study usually lose in the end."
"I soon began to note the periodical recurrence of the rise and fall in stocks and commodities. This led me to conclude that natural law was the basis of market movements. I then decided to devote ten years of my life to the study of natural law as applicable to the speculative markets and to devote my best energies toward making speculation a profitable profession. After exhaustive researches and investigations of the known sciences, I discovered that the law of vibration enabled me to accurately determine the exact points at which stocks or commodities should rise and fall within a given time."
"It is impossible here to give an adequate idea of the law of vibrations as I apply it to the markets. However, the layman may be able to grasp some of the principles when I state that the law of vibration is the fundamental law upon which wireless telegraphy, wireless telephone and phonographs are based. Without the existence of this law the above inventions would have been impossible."
"In going over the history of markets and the great mass of related statistics, it soon becomes apparent that certain laws govern the changes and variations in the value of stocks, and that there exists a periodic or cyclic law which is at the back of all these movements. Observation has shown that there are regular periods of intense activity on the Exchange followed by periods of inactivity."
"Those in close touch with the market have noticed the phenomena of ebb and flow, or rise and fall, in the value of stocks. At certain times a stock will become intensely active, large transactions being made in it; at other times this same stock will become practically stationary or inactive with a very small volume of sales. I have found that the law of vibration governs and controls these conditions. I have also found that certain phases of this law govern the rise in a stock and an entirely different rule operates on the decline."
"I have found that in the stock itself exists its harmonic or inharmonious relationship to the driving power or force behind it. The secret of all its activity is therefore apparent. By my method I can determine the vibration of each stock and also, by taking certain time values into consideration, I can, in the majority of cases, tell exactly what the stock will do under given conditions."
"The power to determine the trend of the market is due to my knowledge of the characteristics of each individual stock and a certain grouping of different stocks under their proper rates of vibration. Stocks are like electrons, atoms and molecules, which hold persistently to their own individuality in response to the fundamental law of vibration. Science teaches that 'an original impulse of any kind finally resolves itself into a periodic or rhythmical motion; also, just as the pendulum returns again in its swing, just as the moon returns in its orbit, just as the advancing year over brings the rose of spring, so do the properties of the elements periodically recur as the weight of the atoms rises."
"From my extensive investigations, studies and applied tests, I find that not only do the various stocks vibrate, but that the driving forces controlling the stocks are also in a state of vibration. These vibratory forces can only be known by the movements they generate on the stocks and their values in the market. Since all great swings or movements of the market are cyclic, they act in accordance with periodic law."
"Science has laid down the principle that the properties of an element are a periodic function of its atomic weight. A famous scientist has stated that 'we are brought to the conviction that diversity in phenomenal nature in its different kingdoms is most intimately associated with numerical relationship. The numbers are not intermixed accidentally but are subject to regular periodicity. The changes and developments are seen to be in many cases as somewhat odd."
"Vibration is fundamental: nothing is exempt from this law. It is universal, therefore applicable to every class of phenomena on the globe."
"Through the law of vibration every stock in the market moves in its own distinctive sphere of activities, as to intensity, volume and direction; all the essential qualities of its evolution are characterized in its own rate of vibration. Stocks, like atoms, are really centers of energy; therefore, they are controlled mathematically. Stocks create their own field of action and power: power to attract and repel, which principle explains why certain stocks at times lead the market and 'turn dead' at other times. Thus, to speculate scientifically it is absolutely necessary to follow natural law."
"After years of patient study I have proven to my entire satisfaction, as well as demonstrated to others, that vibration explains every possible phase and condition of the market."
During the month of October, 1909, in twenty-five market days, W D Gann made, in the presence of third-party representative, two hundred and eighty-six transactions in various stocks, on both the long and short side of the market. Two hundred and sixty-four of these transactions resulted in profits ; twenty-two in losses. The capital with which he operated was doubled ten times, so that at the end of the month he had one thousand percent of his original margin.
Mr. W. D. Gann has refused to disclose his method at any price, but to those scientifically inclined he has unquestionably added to the stock of Wall Street knowledge and pointed out infinite possibilities.
Ralph Elliott
|
Synopsis
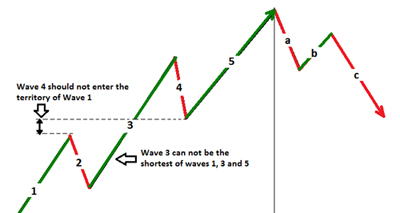
Ralph Nelson Elliott (July 28, 1871 – Jan. 15, 1948) was an American accountant and author, whose study of stock market data led him to develop the Wave Principle, a form of technical analysis that identifies trends in the financial markets. He proposed that market prices unfold in specific patterns, which practitioners today call Elliott waves. In the early 1930s, Elliott began his systematic study of 75-year of stock market data, including index charts with increments ranging from yearly to half-hourly. He detailed the results of his studies by publishing The Wave Principle (1938). Elliott stated that, while stock market prices may appear random and unpredictable, they actually follow predictable, natural laws and can be measured and forecast using Fibonacci numbers. | ||
The Basis of the Wave Principle (by R. N. Elliott, October 1, 1940)
Civilization rests upon change. This change is cyclical in origin and characteristics. A rhythmic series of extreme changes constitutes a cycle. When a cycle has been completed, another cycle is started. The rhythm of the new cycle will be the same as that of the previous cycle, although the extent and duration may vary. The cycle progresses in accordance with the natural law of movement.
The behavior of cycles has been studied extensively by puzzled economists, bankers and businessmen. In this connection, the conservative London Economist in a recent issue, commenting upon the results of a long study of trade cycles made by Sir William Beveridge, the noted British economist, said: "Sir William's researches have emphasized once again that the more the trade cycle is studied, the more it seems to follow the pressure of forces which, if they are not wholly beyond the reach of human control, have at least enough of the inexorable in their nature to make the policies of governments resemble the struggles of fish caught in the tides. Sir William pointed out that the trade cycle ignores politics; he might have added that it overrides economic policies."
The causes of these cyclical changes seem clearly to have their origin in the immutable natural law that governs all things, including the various moods of human behavior. Causes, therefore, tend to become relatively unimportant in the long term progress of the cycle. This fundamental law cannot be subverted or set aside by statutes or restrictions. Current news and political developments are of only incidental importance, soon forgotten; their presumed influence on market trends is not as weighty as is commonly believed.
This law of natural change is inevitable, and applies to the seasons and the movements of the tides and planets. It has truly been said that change is the only "immutable thing in life." Being a natural phenomenon, it necessarily governs all human activities, even the relatively static sciences of biology and botany. Even time and mathematics appear to be amenable to the application of this law of rhythm from the small unit of hours to the great intervals of decades, centuries and millennia. Measuring the behavior of cycles should therefore offer a reliable means of forecasting changes, regardless of the cause, and thus yield handsome profits.
In an independent study of the available data, extending over a period of many years, the writer has observed certain recurring behavior of change in movement. Apparently these changes follow a natural law that inevitably influences the mass. Finally there evolved certain principles, which were carefully tested back over a long period of years.
By 1934, I was able to resolve the various trends of changes in stock prices to a rhythmic series of component waves, which I called a "cycle." This cyclical rhythm has occurred regularly and repeatedly not only in the available records of the various stock exchanges, but also in commodities, industrial production, temperature, music, variation in color, electric output, population movements to and from cities, etc. In fact, it is manifest so widely, not only in human activities but also in the working of nature itself, that I have termed this discovery "The Wave Principle."
Understanding of this law enables the close student to forecast the terminations of cycles by means of the market itself. The Wave Principle is not a "market" system or theory. The forecasting principle involved goes far beyond the concept of any known formula...
Benoit Mandelbrot
|
Synopsis
Benoit Mandelbrot (Nov. 20, 1924 - Oct. 14, 2010) is Polish-born French American mathematician universally known as the father of fractals. Fractals have been employed to describe diverse behavior in economics, finance, the stock market, astronomy, and computer science. Mandelbrot’s work is a stimulating mixture of conjecture and observation, both into mathematical processes and their occurrence in nature and in economics. In 1980 he proposed that a certain set governs the behavior of some iterative processes in mathematics that are easy to define but have remarkably subtle properties. | ||
How Fractals Can Explain What's Wrong with Wall Street
Individual investors and professional traders know better than ever that prices quoted in any financial market often change with heart-stopping swiftness. Fortunes are made and lost in sudden bursts of activity when the market seems to speed up and the volatility soars. The classical financial models predict that such precipitous events should never happen.
A cornerstone of finance is modern portfolio theory, which tries to maximize returns for a given level of risk. The mathematics underlying portfolio theory handles extreme situations with benign neglect: it regards large market shifts as too unlikely to matter or as impossible to take into account. It is true that portfolio theory may account for what occurs 95 percent of the time in the market. But the picture it presents does not reflect reality, if one agrees that major events are part of the remaining 5 percent.
According to portfolio theory, the probability of these large fluctuations would be a few millionths of a millionth of a millionth of a millionth. But in fact, one observes spikes on a regular basis, as often as every month, and their probability amounts to a few hundredths. Granted, the bell curve is often described as normal, or, more precisely, as the normal distribution. But should financial markets then be described as abnormal? Of course not. They are what they are, and it is portfolio theory that is flawed.
Modern portfolio theory poses a danger to those who believe in it too strongly and is a powerful challenge for the theoretician. Though sometimes acknowledging faults in the present body of thinking, its adherents suggest that no other premises can be handled through mathematical modeling. This contention leads to the question of whether a rigorous quantitative description of at least some features of major financial upheavals can be developed. The bearish answer is that large market swings are anomalies, individual “acts of God” that present no conceivable regularity. Revisionists correct the questionable premises of modern portfolio theory through small fixes that lack any guiding principle and do not improve matters sufficiently.
Benoit Mandelbrot claim that variations in financial prices can be accounted for by a model derived from my work in fractal geometry. Fractals, or their later elaboration, called multi-fractals, do not purport to predict the future with certainty. But they do create a more realistic picture of market risks. Given the recent troubles confronting the large investment pools called hedge funds, it would be foolhardy not to investigate models providing more accurate estimates of risk.
An extensive mathematical basis already exists for fractals and multi-fractals. Fractal patterns appear not just in the price changes of securities but in the distribution of galaxies throughout the cosmos, in the shape of coastlines and in the decorative designs generated by innumerable computer programs.
A cornerstone of finance is modern portfolio theory, which tries to maximize returns for a given level of risk. The mathematics underlying portfolio theory handles extreme situations with benign neglect: it regards large market shifts as too unlikely to matter or as impossible to take into account. It is true that portfolio theory may account for what occurs 95 percent of the time in the market. But the picture it presents does not reflect reality, if one agrees that major events are part of the remaining 5 percent.
- The risk-reducing formulas behind portfolio theory rely on a number of demanding and ultimately unfounded premises. First, they suggest that price changes are statistically independent of one another: for example, that today’s price has no influence on the changes between the current price and tomorrow’s. As a result, predictions of future market movements become impossible.
- The second presumption is that all price changes are distributed in a pattern that conforms to the standard bell curve. The width of the bell shape (as measured by its standard deviation) depicts how far price changes diverge from the mean; events at the extremes are considered extremely rare.
According to portfolio theory, the probability of these large fluctuations would be a few millionths of a millionth of a millionth of a millionth. But in fact, one observes spikes on a regular basis, as often as every month, and their probability amounts to a few hundredths. Granted, the bell curve is often described as normal, or, more precisely, as the normal distribution. But should financial markets then be described as abnormal? Of course not. They are what they are, and it is portfolio theory that is flawed.
Modern portfolio theory poses a danger to those who believe in it too strongly and is a powerful challenge for the theoretician. Though sometimes acknowledging faults in the present body of thinking, its adherents suggest that no other premises can be handled through mathematical modeling. This contention leads to the question of whether a rigorous quantitative description of at least some features of major financial upheavals can be developed. The bearish answer is that large market swings are anomalies, individual “acts of God” that present no conceivable regularity. Revisionists correct the questionable premises of modern portfolio theory through small fixes that lack any guiding principle and do not improve matters sufficiently.
Benoit Mandelbrot claim that variations in financial prices can be accounted for by a model derived from my work in fractal geometry. Fractals, or their later elaboration, called multi-fractals, do not purport to predict the future with certainty. But they do create a more realistic picture of market risks. Given the recent troubles confronting the large investment pools called hedge funds, it would be foolhardy not to investigate models providing more accurate estimates of risk.
An extensive mathematical basis already exists for fractals and multi-fractals. Fractal patterns appear not just in the price changes of securities but in the distribution of galaxies throughout the cosmos, in the shape of coastlines and in the decorative designs generated by innumerable computer programs.
A fractal is a geometric shape that can be separated into parts, each of which is a reduced-scale version of the whole. In finance, this concept is not a rootless abstraction but a theoretical reformulation of a down-to-earth bit of market folklore, namely, that movements of a stock or currency all look alike when a market chart is enlarged or reduced so that it fits the same time and price scale. An observer then cannot tell which of the data concern prices that change from week to week, day to day or hour to hour. This quality defines the charts as fractal curves and makes available many powerful tools of mathematical and computer analysis.
In theory, it has no end, but in practice, it makes no sense to interpolate down to time intervals shorter than those between trading transactions, which may occur in less than a minute. Clearly, each piece ends up with a shape roughly like the whole. That is, scale in-variance is present simply because it was built in. These fractal curves exhibit a wealth of structure as a foundation of both fractal geometry and the theory of chaos.
A few selected generators yield so-called uni-fractal curves that exhibit the relatively tranquil picture of the market encompassed by modern portfolio theory. But tranquillity prevails only under extraordinarily special conditions that are satisfied only by these special generators. The assumptions behind this oversimplified model are one of the central mistakes of modern portfolio theory. It is much like a theory of sea waves that forbids their swells to exceed six feet.
The beauty of fractal geometry is that it makes possible a model general enough to reproduce the patterns that characterize portfolio theory’s placid markets. To create a multi-fractal from a uni-fractal, the key step is to lengthen or shorten the horizontal time axis so that the pieces of the generator are either stretched or squeezed. Each time the first piece of the generator is further shortened, and the process of successive interpolation is undertaken, it produces a chart that increasingly resembles the characteristics of volatile markets.
What should a corporate treasurer, currency trader or other market strategist conclude from all this? The discrepancies between the pictures painted by modern portfolio theory and the actual movement of prices are obvious. Prices do not vary continuously, and they oscillate wildly at all timescales. Volatility, far from a static entity to be ignored or easily compensated for, is at the very heart of what goes on in financial markets. In the past, money managers embraced the continuity and constrained price movements of modern portfolio theory because of the absence of strong alternatives. But a money manager need no longer accept the current financial models at face value. Multi-fractals describe accurately the relation between the shape of the generator and the patterns of up-and-down swings of prices to be found on charts of real market data.
On a practical level, this finding suggests that a fractal generator can be developed based on historical market data. The actual model used does not simply inspect what the market did yesterday or last week. It is in fact a more realistic depiction of market fluctuations, called fractional Brownian motion in multi-fractal trading time. The charts created from the generators produced by this model can simulate alternative scenarios based on previous market activity.
These techniques do not come closer to forecasting a price drop or rise on a specific day on the basis of past records. But they provide estimates of the probability of what the market might do and allow one to prepare for inevitable future changes. The new modeling techniques are designed to cast a light of order into the seemingly impenetrable thicket of the financial markets.