"To know values is to know the meaning of the market."
- Charles Dow
Gerald Appel

|
Synopsis
Gerald Appel is perhaps best known as the inventor of the MACD, the popular moving average convergence/divergence indicator. The MACD is a statistical stock market timing model and technical analysis tool that is widely respected and used by traders, investors, and money managers. He started out as a personal trader during the mid-1960s. He invented MACD in 1977 when he was looking for a new quality indicator that would be readily interpretable, that would not create so many whipsaws as to be confusing, and that would still be relatively simple to maintain. | ||
Moving Average Convergence-Divergence (MACD)
Moving averages are some of most simple technical indicators investors use. While their simplicity makes them very popular, they do suffer from one drawback—they are trend-following indicators that work best during strong trending periods. During sideways or choppy markets, moving averages tend to generate false signals and are prone to “whip-saws,” where buy or sell signals are reversed in a short time.
To overcome this, technicians use an indicator called the oscillator, which is more sensitive, and thus more responsive, to this kind of market activity. Oscillators may be used to determine overbought or oversold conditions as well as whether there is a divergence between price and the indicator. One indicator combines the trend-following characteristics of moving averages with oscillator characteristics that help indicate whether a security is overbought or oversold and help pinpoint possible divergences. The indicator is called moving average convergence-divergence, or MACD.
To overcome this, technicians use an indicator called the oscillator, which is more sensitive, and thus more responsive, to this kind of market activity. Oscillators may be used to determine overbought or oversold conditions as well as whether there is a divergence between price and the indicator. One indicator combines the trend-following characteristics of moving averages with oscillator characteristics that help indicate whether a security is overbought or oversold and help pinpoint possible divergences. The indicator is called moving average convergence-divergence, or MACD.
Developed by Gerald Appel in the late1970s, MACD turns two trend-following moving averages into a momentum oscillator by deducting the longer-period moving average from the shorter-period one. Specifically, the MACD is commonly calculated as follows:
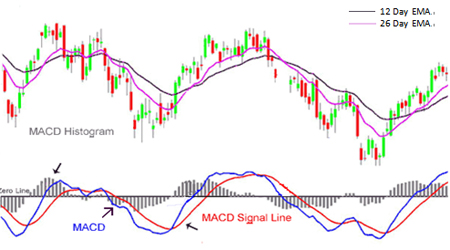
The MACD line is the 12-day exponential moving average (EMA) less the 26-day EMA. Typically closing prices are used. Exponential moving averages are similar to simple moving averages, except that more weight is given to the latest data. As a result, this type of moving average reacts faster to recent price changes than a simple moving average.
The signal line is a nine-day EMA of the MACD line and is plotted along with the MACD line on a chart. It is the interaction between these two lines—crossovers and divergences—that traders look for. Lastly, the MACD histogram measures the difference between the MACD line and the signal line. It is positive when the MACD line is above the signal line and negative when the signal line is above the MACD Line. The 12-, 26- and nine-day settings are the typical settings used for the MACD. However, you can adjust the lengths to fit your trading style. Furthermore, you can use the MACD with daily, weekly or monthly charts.
As implied by its name, the MACD is concerned with the convergence and divergence of the two exponential moving averages. Convergences occur when the two lines move toward each other, while divergences take place when the two moving averages move away from each other. The MACD line oscillates above and below the “zero” line or center-line. The MACD is above the center-line whenever the 12-day EMA is above the 26-day EMA. Crossovers above or below the center-line take place when the 12- and 26-day EMAs cross. A rising MACD line means the 12-day EMA is diverging further from the 26-day EMA, which indicates rising upside momentum. The MACD falls as the 12-day EMA diverges further below the 26-day EMA. This indicates that downside momentum is increasing.
- MACD Line = 12-day EMA – 26-day EMA
- Signal Line = 9-day EMA of MACD Line
- MACD Histogram = MACD Line – Signal Line
The MACD line is the 12-day exponential moving average (EMA) less the 26-day EMA. Typically closing prices are used. Exponential moving averages are similar to simple moving averages, except that more weight is given to the latest data. As a result, this type of moving average reacts faster to recent price changes than a simple moving average.
The signal line is a nine-day EMA of the MACD line and is plotted along with the MACD line on a chart. It is the interaction between these two lines—crossovers and divergences—that traders look for. Lastly, the MACD histogram measures the difference between the MACD line and the signal line. It is positive when the MACD line is above the signal line and negative when the signal line is above the MACD Line. The 12-, 26- and nine-day settings are the typical settings used for the MACD. However, you can adjust the lengths to fit your trading style. Furthermore, you can use the MACD with daily, weekly or monthly charts.
As implied by its name, the MACD is concerned with the convergence and divergence of the two exponential moving averages. Convergences occur when the two lines move toward each other, while divergences take place when the two moving averages move away from each other. The MACD line oscillates above and below the “zero” line or center-line. The MACD is above the center-line whenever the 12-day EMA is above the 26-day EMA. Crossovers above or below the center-line take place when the 12- and 26-day EMAs cross. A rising MACD line means the 12-day EMA is diverging further from the 26-day EMA, which indicates rising upside momentum. The MACD falls as the 12-day EMA diverges further below the 26-day EMA. This indicates that downside momentum is increasing.
Welles Wilder

|
Synopsis
Welles Wilder is best known for his technical indicators, including Average True Range, the Relative Strength Index, Directional Movement and the Parabolic Stop and Reverse. He started his working life as a mechanical engineer, and remained an engineer for just seven years. This overlapped with his investing in the real estate market which he then did full time for a few years. He commenced 13 years of full-time market research and trading in his "retirement." He embarked to study and learn all he could about futures markets. His first book, New Concepts in Technical Trading Systems, remains an important reference for both stock and futures traders. |
RSI and SAR Concepts in Technical Trading Systems
Developed J. Welles Wilder, the Relative Strength Index (RSI) is a momentum oscillator that measures the speed and change of price movements. RSI (Relative Strength Index) oscillates between zero and 100. Traditionally, and according to Wilder, RSI is considered overbought when above 70 and oversold when below 30. Signals can also be generated by looking for divergences, failure swings and center-line crossovers. RSI can also be used to identify the general trend.
RSI is an extremely popular momentum indicator that has been adopted by technical analysts over the years. Wilder features RSI in his 1978 book, "New Concepts in Technical Trading Systems". This book also includes the Parabolic SAR, Average True Range and the Directional Movement Concept (ADX). Despite being developed before the computer age, Wilder's indicators have stood the test of time and remain extremely popular. Here’s a simple walk-through and definition of RSI.
RSI is an extremely popular momentum indicator that has been adopted by technical analysts over the years. Wilder features RSI in his 1978 book, "New Concepts in Technical Trading Systems". This book also includes the Parabolic SAR, Average True Range and the Directional Movement Concept (ADX). Despite being developed before the computer age, Wilder's indicators have stood the test of time and remain extremely popular. Here’s a simple walk-through and definition of RSI.
A momentum indicator like RSI aims to show which of the bulls (optimists) or the bears (pessimists) are stronger in the current market. Getting to know your market through an RSI indicator can let you pin point reversals more accurately and thereby let you position yourself accordingly.
The RSI indicator uses the closing prices of completed trading periods to determine who owns the momentum in the market. It assumes that prices close higher in strong market periods (bull markets), and lower in weaker periods (bears owning the scene) and computes this as a ratio of the number of higher closes to the lower closes during a certain period of time, most commonly used is the period of 14 days.
Most stock charts packages out there today include the RSI indicator. Here is how it is calculated manually.
Applying the RS in the first RSI formula, will give you a value between 0 and 100. The real challenge with Relative Strength Index is to know what boundaries apply for when a market is overbought and oversold respectively. This is the real trick and usually only comes to you after having studied a market thoroughly. Then, and only then, do you know where it usually turns and can thereby learn to recognize when a new turn is coming.
Parabolic SAR (Stop And Reverse) is another important technical indicator introduced by J. Welles Wilder, Jr. in his book "New Concepts in Technical Trading Systems". The name of the indicator is due to the nature that it resembles a parabola curve. It
is a very popular technical indicator for setting trailing price stops for long or short positions.
The RSI indicator uses the closing prices of completed trading periods to determine who owns the momentum in the market. It assumes that prices close higher in strong market periods (bull markets), and lower in weaker periods (bears owning the scene) and computes this as a ratio of the number of higher closes to the lower closes during a certain period of time, most commonly used is the period of 14 days.
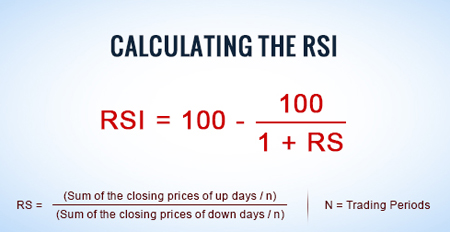
Most stock charts packages out there today include the RSI indicator. Here is how it is calculated manually.
- RSI = (100 – (100 / (1 + RS)))
- RS = 14-day EMA of up-day closing gains / 14-day EMA of down-day closing losses
Applying the RS in the first RSI formula, will give you a value between 0 and 100. The real challenge with Relative Strength Index is to know what boundaries apply for when a market is overbought and oversold respectively. This is the real trick and usually only comes to you after having studied a market thoroughly. Then, and only then, do you know where it usually turns and can thereby learn to recognize when a new turn is coming.
Parabolic SAR (Stop And Reverse) is another important technical indicator introduced by J. Welles Wilder, Jr. in his book "New Concepts in Technical Trading Systems". The name of the indicator is due to the nature that it resembles a parabola curve. It
is a very popular technical indicator for setting trailing price stops for long or short positions.
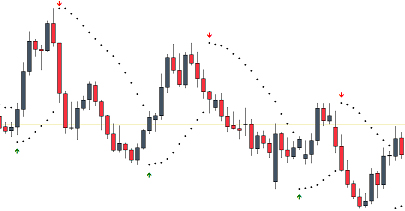
The general formula for calculating Parabolic SAR is as follows:
To illustrate an example for the formula, let’s assume you are going long and the price is on an uptrend. The SAR value today is 30.
- SAR for the Next Day = SAR Today + Acceleration Factor x (Extreme Point - SAR Today)
To illustrate an example for the formula, let’s assume you are going long and the price is on an uptrend. The SAR value today is 30.
- From the point you have started long, the highest price reached is 35.
- SAR for the Next Day = 30 + 0.02 x (35 - 30) = 30.3.
- On the following day, the price increases to 36. SAR for the Next Day = 30.3 + 0.04 x (36 - 30.3) = 30.528.
Joe Granville

|
Synopsis
Joseph Ensign Granville (Aug. 20, 1923 – Sept. 7, 2013), often called Joe Granville, was a financial writer and investment seminar speaker. He is most famous for inventing and developing the concept "On Balance Volume" (OBV). Granville argued that when volume increases sharply without a significant change in a stock's price, the price will eventually increase rapidly, and vice versa. On balance volume is thus one tool of technical analysis that attempts to predict future prices of stocks, commodities, and other financial assets traded on financial markets for which historical price and volume information is available. | ||
On Balance Volume (OBV)
On Balance Volume (OBV) measures buying and selling pressure as a cumulative indicator that adds volume on up days and subtracts volume on down days. It was one of the first indicators to measure positive and negative volume flow. This indicator helps us to confirm the price trends. On balance volume combines price and volume to determine whether price movements are strong or are weak.
On Balance Volume (OBV) calculation is quite simpler. If the close value exceeds the previous close then volume becomes positive otherwise negative. For On Balance Volume value we have to add previous OBV value with the volume. For the first OBV value take the first volume value.
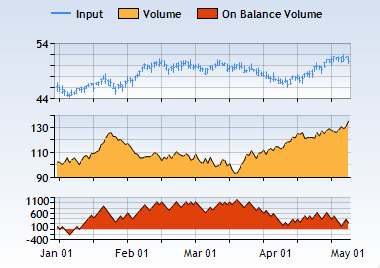
The On Balance Volume (OBV) line is simply a running total of positive and negative volume. A period's volume is positive when the close is above the prior close. A period's volume is negative when the close is below the prior close. On an up day, the volume is added to the previous day's OBV .On a down day, the volume is subtracted from the previous day's OBV.
If the closing price is above the prior close price then:
Granville theorized that volume precedes price. OBV rises when volume on up days outpaces volume on down days. OBV falls when volume on down days is stronger. A rising OBV reflects positive volume pressure that can lead to higher prices. Conversely, falling OBV reflects negative volume pressure that can foreshadow lower prices. Granville noted in his research that OBV would often move before price. Expect prices to move higher if OBV is rising while prices are either flat or moving down. Expect prices to move lower if OBV is falling while prices are either flat or moving up.
The absolute value of OBV is not important. First define the trend for OBV. Second, determine if the current trend matches the trend for the underlying security. Third, look for potential support or resistance levels. Once broken, the trend for OBV will change and these breaks can be used to generate signals. Also notice that OBV is based on closing prices. Therefore, closing prices should be considered when looking for divergences or support/resistance breaks. And finally, volume spikes can sometimes throw off the indicator by causing a sharp move that will require a settling period.
In summary, OBV is a simple indicator that uses volume and price to measure buying pressure and selling pressure. It is also used for confirm the trend. Buying pressure is evident when positive volume exceeds negative volume and the OBV line rises. Selling pressure is present when negative volume exceeds positive volume and the OBV line falls. Technical analyst can use OBV to confirm the underlying trend or look for divergences that may foreshadow a price change. As with all indicators, it is important to use OBV in conjunction with other aspects of technical analysis.
The On Balance Volume (OBV) line is simply a running total of positive and negative volume. A period's volume is positive when the close is above the prior close. A period's volume is negative when the close is below the prior close. On an up day, the volume is added to the previous day's OBV .On a down day, the volume is subtracted from the previous day's OBV.
If the closing price is above the prior close price then:
- Current OBV = Previous OBV + Current Volume
- Current OBV = Previous OBV - Current Volume
- Current OBV = Previous OBV (no change)
Granville theorized that volume precedes price. OBV rises when volume on up days outpaces volume on down days. OBV falls when volume on down days is stronger. A rising OBV reflects positive volume pressure that can lead to higher prices. Conversely, falling OBV reflects negative volume pressure that can foreshadow lower prices. Granville noted in his research that OBV would often move before price. Expect prices to move higher if OBV is rising while prices are either flat or moving down. Expect prices to move lower if OBV is falling while prices are either flat or moving up.
The absolute value of OBV is not important. First define the trend for OBV. Second, determine if the current trend matches the trend for the underlying security. Third, look for potential support or resistance levels. Once broken, the trend for OBV will change and these breaks can be used to generate signals. Also notice that OBV is based on closing prices. Therefore, closing prices should be considered when looking for divergences or support/resistance breaks. And finally, volume spikes can sometimes throw off the indicator by causing a sharp move that will require a settling period.
In summary, OBV is a simple indicator that uses volume and price to measure buying pressure and selling pressure. It is also used for confirm the trend. Buying pressure is evident when positive volume exceeds negative volume and the OBV line rises. Selling pressure is present when negative volume exceeds positive volume and the OBV line falls. Technical analyst can use OBV to confirm the underlying trend or look for divergences that may foreshadow a price change. As with all indicators, it is important to use OBV in conjunction with other aspects of technical analysis.
Marc Chaikin

|
Synopsis
Marc Chaikin began as a stock broker in 1965. Chaikin spent much of his career developing computerized stock selection models for money managers. He is especially recognized for his development of the Accumulation/Distribution Line indicator (ADL). Chaikin also developed the Chaikin Volume Accumulator (VAC) indicator. The two major indicators associated with the ADL are the Chaikin Oscillator and the Chaikin Money Flow indicators, both of which have been heavily used on Wall Street since their inceptions. In the late 2000s, he started Chaikin Analytics which tried to distill complex information into a simple green/red Power Gauge Rating: green for bullish, red for bearish. | ||
Chaikin Money Flow (CMF)
The Chaikin Money Flow (CMF) was developed by Marc Chaikin to determine if a stock is under accumulation or distribution by comparing the closing price to the high-low range of the trading session. In layman's terms, if the stock closes near the high of the session with increased volume, the CMF increases in value. Conversely, if the stock closes near the low of the session with increased volume, the CMF decreases in value. The CMF indicator was developed as an expansion to the On Balance Volume (OBV) indicator.
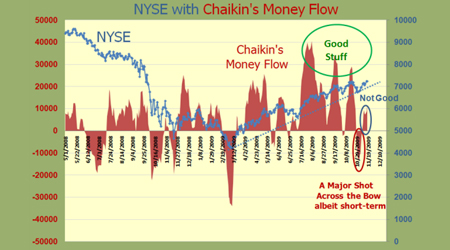
The basic trading premise with the CMF indicator is if the indicator is above 0 this is a bullish sign, while a reading below 0 represents a bearish signal. Reading above +.25 or below -.25 indicate strong trends and positions can be added on minor corrections. CMF is calculated using the following steps. It is typically based on 20-periods.
First, calculate the Money Flow Multiplier for each period.
Note that each period's Money Flow Multiplier is positive when the close is in the upper a half of the period's high-low range and negative when the close is in the lower half. The multiplier equals 1 when the close equals the high and -1 when the close equals the low. In this way the multiplier adjusts the amount of volume that ends up in Money Flow Volume. Volume is in effect reduced unless the Money Flow Multiplier is at its extremes (+1 or -1).
CMF measures the amount of Money Flow Volume over a specific period. Money Flow Volume forms the basis for the Accumulation Distribution Line. Instead of a cumulative total of Money Flow Volume, Chaikin Money Flow simply sums Money Flow Volume for a specific look-back period 20 days. The resulting indicator fluctuates above/below the zero line just like an oscillator. Technical analysts weigh the balance of buying or selling pressure with the absolute level of CMF, and look for crosses above or below the zero line to identify changes on money flow.
Similar to OBV, As an money flow oscillator, CMF can be used in conjunction with pure price oscillators, such as MACD or RSI. Like many other indicators, unfortunately, traders need to draw trend lines on the indicators themselves and look for both breakouts on the indicator and the price on the chart. This method is very subjective, since the trader will have to accurately identify the trend on the indicator. As with all indicators, CMF may not be reliable when used as a stand-alone indicator.
First, calculate the Money Flow Multiplier for each period.
- Money Flow Multiplier = [(Close - Low) - (High - Close)] /(High - Low)
- Money Flow Volume = Money Flow Multiplier x Volume for the Period
- 20-period CMF = 20-period Sum of Money Flow Volume / 20 period Sum of Volume
Note that each period's Money Flow Multiplier is positive when the close is in the upper a half of the period's high-low range and negative when the close is in the lower half. The multiplier equals 1 when the close equals the high and -1 when the close equals the low. In this way the multiplier adjusts the amount of volume that ends up in Money Flow Volume. Volume is in effect reduced unless the Money Flow Multiplier is at its extremes (+1 or -1).
CMF measures the amount of Money Flow Volume over a specific period. Money Flow Volume forms the basis for the Accumulation Distribution Line. Instead of a cumulative total of Money Flow Volume, Chaikin Money Flow simply sums Money Flow Volume for a specific look-back period 20 days. The resulting indicator fluctuates above/below the zero line just like an oscillator. Technical analysts weigh the balance of buying or selling pressure with the absolute level of CMF, and look for crosses above or below the zero line to identify changes on money flow.
Similar to OBV, As an money flow oscillator, CMF can be used in conjunction with pure price oscillators, such as MACD or RSI. Like many other indicators, unfortunately, traders need to draw trend lines on the indicators themselves and look for both breakouts on the indicator and the price on the chart. This method is very subjective, since the trader will have to accurately identify the trend on the indicator. As with all indicators, CMF may not be reliable when used as a stand-alone indicator.