"If you can't explain it simply, you don't understand it well enough."
- Albert Einstein
Charlie Yang

|
Synopsis
Charlie Q. Yang was born in Shanghai, China. His childhood dream was to be a self-taught engineer, scientist, and philosopher, not to become a medical doctor like his parents who suffered during the cultural revolution. Following his deep passion in the understanding capital market, he has been conducting research on investor behavior since 1996 and summarized his findings on various research and education sites. In particular, the Yin-Yang Index has been developed by Yang as a real-time investor psychology measuring system for scientifically back-testing and validating his Capital Market Behavior Theory. | ||
Why the Modern Portfolio Theory is Flawed and Misleading
The general understanding of the financial industry has been that return and risk are real and fundamental. Therefore we have been so used to and positive for any description of the capital market by Nobel Prize-winning economics works. That led us to believe that the modern portfolio theory and related academic research are true descriptions of the market.
If we have observed the stock market movements more in-depth and long enough, many of us have seen evidence that return and risk (standard deviation) are not fundamental. They are actually derived or emergent concepts. We all know what temperature means. It means something to be hot or cold. Scientific discoveries taught us that temperature is just an emergent idea and the fundamental idea is the motions of atoms.
From the day in 1995 when I discovered how flawed and misleading the Normal distribution (bell-curve) is when being applied to the real-world as a statistical model, I started to question the financial industry’s academic foundation. What Wall Street has been using are all the derived capital market measures from the modern portfolio theory. They are just emergent ideas. They are all built on unrealistic and oversimplified assumptions on their roots and thus can be so easily misused to make the theory superficial and flawed, even to cause a financial crisis.
The fundamental motivation of my new financial market research is to discover the scientific phenomena governing each trading tick’s movement (similar to atoms in physics).
Since 1995, I have been trying to capture my findings through the framework named the Capital Market Behavior Theory. With the new scientific discoveries being validated by real-world data over the last 20 years, we will finally be able to pinpoint the actual fundamental ingredients that make up our investment concepts of return and risk.
Advances in Capital Market Laws of Motions
The research goes beyond the Dow theory and the other existing theories are motivated by the fact that even the world's smartest men were not immune to the market emotions. We hope Newton could read the following information on Capital Market Behavior Theory (CMBT) so as not to feel regret since his wish to "calculate the madness of people" has been coming true.
Dr. Charlie Q. Yang's 20-year research finds that Newton's Three Laws of Motion are still valid when observing the market actions driving the prices up or down. With Newton's laws and the enhanced Dow Theory principles (i.e. the new Capital Market Behavior Theory, see below), the market behaviors can be properly measured directly and the movements of such price behaviors should still closely follow Newton's laws. The validation of such a new hypothesis has been completed with the development of the new "Yin-Yang Index" real-time computing system.
Newton’s Three Laws for Stock Market
For a couple centuries before Einstein, Newton’s Laws were the basic principles of Physics. These laws are still valid and they are the basis for much engineering analysis today. The formal statements of Newton’s Three Laws are given below. Our explanations of Newton’s Three Laws as applied to stock market price movements are given below each formal statement.
Newton’s First Law:
An object at rest tends to stay at rest and an object in motion tends to stay in motion with the same speed and in the same direction unless acted upon by an unbalanced external force.
Stock Market First Law Explanation (by Charlie Yang): Inertia is a property of stock market movement trend that resists changes in direction. If there are no fundamental events that cause a material change of a company, the stock's price trend will stay that way (up, down, or sideways) until a new material changing event that creates an external force to make the trend change or reversal. The price changes in an up or downtrend will slow down due to friction caused by valuation concerns, and a new material event could accelerate the price changes and thus the slope of trend lines.
Newton’s Second Law:
The acceleration (a) of an object as produced by a net force F is directly proportional to the magnitude of the net force, in the same direction as the net force, and inversely proportional to the mass m of the object: F = ma.
Stock Market Second Law Explanation (by Charlie Yang): A material event impact force F acting on stock will accelerate its price movement in the direction of F (positive or negative), with acceleration a = F/m. Acceleration is the change in trend line slope. The mass m here is the present intrinsic value of the company. If the intrinsic value has no quantifiable change by the force immediately, the price movement will change with a new accelerated up or downtrend.
Newton’s Third Law:
For every action, there is an equal and opposite reaction.
Stock Market Third Law Explanation (by Charlie Yang): This law is familiar to many experienced investors or traders. A buy or sell trade order cannot be filled for any given stock unless there is the same quantity sell or buy order reacting to the initiating trade action. For example, a stock sold by a seller with an opinion to be bearish, there is always a buyer with the opposite opinion to be bullish.
Advances from Dow Theory to Capital Market Behavior Theory
Capital Market Behavior Theory is formed by the following 10 principles which provide a new behavioral interpretation of capital market pricing beyond Dow Theory.
1. A trend is driven only by those taking trading actions - The primary price movement trend is mainly driven by the behavior of those investors who take trading actions; not by anyone else who takes no trading actions.
2. Market trend reversal can be detected from early bullish or bearish trading actions - "Smart money" trades from institutions and related parties offer early signals of a trend reversal. Those trading actions with up or downticks supported by volumes contribute to trends and trend reversals.
3. A trend can be timely identified if net sentiment can be measured - Long-term or short-term trend reversals can be identified most of the times in advance or with a little delay if we can measure the net effect of bull or bear market sentiment.
4. A trend is determined by volumes and changes in prices, not by absolute prices- Past prices have no direct impact in the future prices which are only affected by changes of prices and volumes by trading actions.
5. Trend reversal happens when the net effect of bulls and bears crosses zero - If any system can measure the total force of bullish buyers and the total force of bearish sellers, the trend reversal will then happen when the net effect of the combined force measure crosses zero. The trend reversal is subject to happen anytime.
6. The effect of all events will affect the market trend - Any events, including but not limited to earnings, investor expectations, research reports, and political policies will all create a certain impact to affect the market trend. If the effect is strong enough, the primary trend reversal can be triggered.
7. Fundamental value can be created or destroyed by trading actions - Through trading actions, the market prices can be inflated and deflated and thus the perceived value can change over time. It, in turn, can create or destroy the fundamental value of the underlying business due to the availability of capital market funding. The stock market is not a zero-sum game as some may falsely believe.
8. The market price is just the value perceived by all interested buyers and sellers - Market price is determined by the collective effect of all bullish and bearish investors’ perception of the value at any given time. Fundamental value is a factor but it does not directly determine the market prices.
9. Risk control can only be done by design, not by short-term timing - Investment portfolio risk management can be optimized by asset allocation design, not by short-term timing of secondary or minor trends. If a primary long-term bull or bear trend can be detected, the weighting towards more aggressive or more conservative can enable a portfolio to out-perform the market. If the primary trend cannot be detected (side-way market), portfolio re-balancing will add value.
10. The stock market is a leading economic cycle indicator - The stock market overall driven by trading actions is a good long-term economic indicator.
Advances in Yin-Yang Index as an Investor Emotion Indicator
The stock market trend behaves from quantitative change to qualitative change all the time. This is because of the unpredictable nature of future significant forces (various events such as political policy change) which can trigger the transition of such changes. The stock market trend can be predicted during the quantitative phase and detected when the transition to qualitative phase is triggered. The process of the quantitative change is defined as when the economical cycles are gradually improving (bull) or deteriorating (bear) without significant (material) new forces (events).
According to Yang's Capital Market Behavior Theory (CMPT), the stock market trend reversal happens where the overall bullish forces overtaking the overall bear forces in controlling the market direction, or vice versa. The feasibility and justification of such a detection or prediction power are based on the fact that except encountering sudden significant forces, the gradual movement of the stock market is phased by the money flows with various smart levels. The smarter money trades early and the general public money always trades the last.
The Yin-Yang Index is created by Yang based on his Capital Market Behavior Theory. It is a new scientific system for capital market cycle reversal signal detection and prediction. Process of Deriving Yin-Yang Index is as follows:
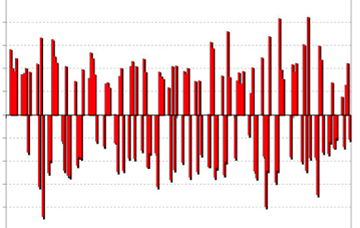
Step 1: The intra-day trading actions for a given stock (or ETF) are sampled by measuring up-ticks and down-ticks weighted with market order volumes;
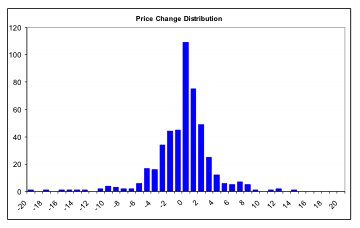
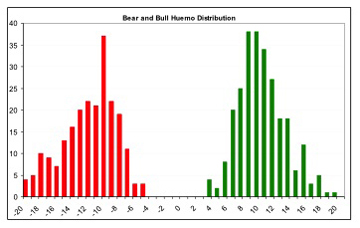
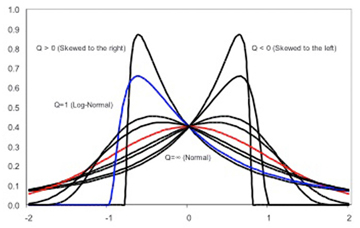
Step 2: The resulting statistical samples over a defined period are captured as random noises, and then processed into single-mode price normal distribution, and dual-mode bull/bear distributions as shown.
According to Yang's Capital Market Behavior Theory (CMPT), the stock market trend reversal happens where the overall bullish forces overtaking the overall bear forces in controlling the market direction, or vice versa. The feasibility and justification of such a detection or prediction power are based on the fact that except encountering sudden significant forces, the gradual movement of the stock market is phased by the money flows with various smart levels. The smarter money trades early and the general public money always trades the last.
The Yin-Yang Index is created by Yang based on his Capital Market Behavior Theory. It is a new scientific system for capital market cycle reversal signal detection and prediction. Process of Deriving Yin-Yang Index is as follows:
Step 1: The intra-day trading actions for a given stock (or ETF) are sampled by measuring up-ticks and down-ticks weighted with market order volumes;
Step 2: The resulting statistical samples over a defined period are captured as random noises, and then processed into single-mode price normal distribution, and dual-mode bull/bear distributions as shown.
|
|
|
|
Step 3: Dual-mode distribution is then modeled by Q-Distributions with optimized Q calculated.
Step 4: The Yin-Yang Index is derived with additional steps of normalization and incorporates other parameters for complete presentation to create the final Yin-Yang Index chart.
Step 4: The Yin-Yang Index is derived with additional steps of normalization and incorporates other parameters for complete presentation to create the final Yin-Yang Index chart.
Advances in Technical Analysis Indicators
Even though many technicians see little advantage in coupling volume with price, some successful attempts have been made in the past to add volume into consideration to give a more complete representation of stock market behavior.
Volume can be viewed as a measure of supply and demand for the given security. When market emotion level is high on a stock, its traded volume will increase, and vice versa. Volume grows when new buyers and new sellers enter the market in anticipation of more significant price movement. Such a volume-driven price movement could indicate the formation of a new trend, either up or down, depending on the prevailing fundamental changes of the underlying security.
Among those technicians who attempted to take consideration of volume, Joe Granville introduced the On Balance Volume (OBV) indicator. OBV is a simple indicator that can provide important trend confirmation, convergence and divergence signals over longer-term time periods. However, OBV has a few limitations:
Many researchers have tried to overcome the limitations of OBV by using different volumes and price formulation. Perhaps the most popular attempt was made by Marc Chaikin in developing his Chaikin Money Flow (CMF) indicator. Instead of using the close price, he used the mean price. Based on whether a stock closed in its upper or lower half of the day’s action, Chaikin would either add or subtract volume. The basic premise behind the CMF is that the degree of buying or selling pressure can be determined by the location of the close relative to the high and low for the corresponding period. There is buying pressure when a stock closes in the upper half of a period's range and there is selling pressure when a stock closes in the lower half of the period's trading range.
Chaikin has suggested using the last 21 days as the typical period for calculating CMF. Further examination unveils that CMF is not a clear indicator for identifying long-term trend reversals with the following limitations. Notice that a similar weakness can also be seen for other known money flow indicators when they are applied to long-term trend analysis.
The new Yin-Yang Index is all about measuring market psychology. It has been undergoing over 20 years of scientific development and real-time engineering validation:
Prior to 1994:
Volume can be viewed as a measure of supply and demand for the given security. When market emotion level is high on a stock, its traded volume will increase, and vice versa. Volume grows when new buyers and new sellers enter the market in anticipation of more significant price movement. Such a volume-driven price movement could indicate the formation of a new trend, either up or down, depending on the prevailing fundamental changes of the underlying security.
Among those technicians who attempted to take consideration of volume, Joe Granville introduced the On Balance Volume (OBV) indicator. OBV is a simple indicator that can provide important trend confirmation, convergence and divergence signals over longer-term time periods. However, OBV has a few limitations:
- It is difficult to identify a divergence in its early stage on a long -term OBV chart. According to Granville, investors must act quickly and decisively if they wish to profit from OBV analysis. Thus OBV maybe only best suitable to signal a possible short-term trend reversal.
- OBV does not provide clear bull versus bear trend indication since it does not have a centerline. For a centered indicator (e.g., MACD), the trend is bullish when the value of the indicator is above its centerline and bearish when the value is below its center line.
- The value of OBV does not indicate an overbought or oversold condition. The starting point for an OBV chart is arbitrary. Only the shape of the resulting indicator is used, not the actual level of the OBV.
Many researchers have tried to overcome the limitations of OBV by using different volumes and price formulation. Perhaps the most popular attempt was made by Marc Chaikin in developing his Chaikin Money Flow (CMF) indicator. Instead of using the close price, he used the mean price. Based on whether a stock closed in its upper or lower half of the day’s action, Chaikin would either add or subtract volume. The basic premise behind the CMF is that the degree of buying or selling pressure can be determined by the location of the close relative to the high and low for the corresponding period. There is buying pressure when a stock closes in the upper half of a period's range and there is selling pressure when a stock closes in the lower half of the period's trading range.
Chaikin has suggested using the last 21 days as the typical period for calculating CMF. Further examination unveils that CMF is not a clear indicator for identifying long-term trend reversals with the following limitations. Notice that a similar weakness can also be seen for other known money flow indicators when they are applied to long-term trend analysis.
- Marc Chaikin suggested using 21-day data for the summation in CMF calculation. When this form of CMF applies to longer-term trend analysis, 21-day is too short. It fails to provide any meaningful indication.
- The straightforward application of CMF for primary trend analysis may be obtained by using 200-day as the summation or averaging period. The resulting CMF showed poor indication power such as there was a strongly positive (bull) money flow in 2002 while SPY suffered the big loss in that year.
- CMF is a centered oscillator with a simple interpretation of the money flow concept. Unlike the other popular indicators such as MACD, a positive or a negative CMF value does not directly indicate a bull or a bear market status of a primary trend.
The new Yin-Yang Index is all about measuring market psychology. It has been undergoing over 20 years of scientific development and real-time engineering validation:
Prior to 1994:
- The oversimplified assumptions in the Modern Portfolio Theory (MPT) were questioned.
- The Normal distribution (bell-curve) as the foundation for calculating investment returns, risks, Alpha, and Beta were challenged
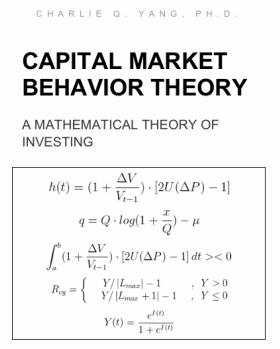
- Discovery of Q-Distribution by Dr. Charlie Q. Yang to extend the versatility of Normal distribution assumed by MPT
- Development of CMBT Theory by Dr. Charlie Q. Yang to expand the principles of the Dow Theory
- Implementation of the Yin-Yang Index system to measure the capital market sentiment in real-time
- Statistical validation of the Yin-Yang Index as a predictive or concurrent indicator using real-time market data
Advances in Stock Market Interpretation and Predictability
When the 2013 Nobel Prizes in Economics were announced, both financial academics and practitioners became somehow confused. The awards were given to Eugene Fama, who is best known for originating the Efficient Market hypothesis, and Robert Shiller, who once claimed the efficient market hypothesis as “one of the most remarkable errors in the history of economic thought,” and professor Lars Peter Hansen, whose work seemed not really connected to Fama and Shiller at all. The prizes were awarded “for their empirical analysis of asset prices,” but what the three had done are quite different, if not having opposite arguments.
The scientific answer about the stock market behaviors turns out to be more complicated than markets are efficient — or markets are inefficient. Charlie Yang's CMBT helps improve our understanding of human behaviors by answering the question of how and when we can predict and/or detect the stock market movement.
The scientific answer about the stock market behaviors turns out to be more complicated than markets are efficient — or markets are inefficient. Charlie Yang's CMBT helps improve our understanding of human behaviors by answering the question of how and when we can predict and/or detect the stock market movement.
- Why - why is the stock market trend sometimes predictable, sometimes detectable only, and sometimes random? It is because future forces (various events) are unpredictable in terms of timing and exact scale, such as political policy changes.
- When - the stock market trend may be predicted when the economical cycles are gradually improving or deteriorating without significant new forces or material events.
- Who - the stock market movements are driven only by those people who place trade orders to support (buy) or vote against (sell) the underlying prices.
- Where - the stock market trend reversal happens where the overall bullish forces are overtaking the overall bear forces in controlling the market direction or vice versa.
- What - except encountering sudden significant forces, the movements of the stock market are gradually pushed by what is known as "smartness" of the money flows, i.e., the smart money acts early and the general public money always trades the last.
- How - a new computing process can be implemented to explain how to predict and/or detect the market trend. It is done by sampling trading ticks weighted by volumes from everyday trades and then processing the samples to derive the ultimate market trend signals. This process makes no simplified assumptions, in contrast to the theories proposed by Harry Markowitz and Eugene Fama.
Summary of Capital Market Behavior Theory
While Yang was trying to improve statistical modeling for financial simulation from 1994 to 1996, he discovered a new probability distribution which he named as "Q-Distribution". It is a family of statistical distributions unifying the popular normal and log-normal distributions and many others. Yang was fascinated by the discovery and realized its application potential in almost any field as a significant accuracy improvement over the normal distribution (bell-curve). He documented the findings as a research paper titled "Q-Distributions - A Family of Generalized Normal Distributions" and moved on. This unpublished piece has continuously motivated him to further discover the deeper scientific principles governing the capital market behaviors. Increasingly he realizes that the market is so unpredictable and so difficult to model, but its movement is directly driven by human behaviors, less so and indirectly by various fundamental and technical factors. This research led to the discovery and formation of the Capital Market Behavior Theory (CMBT).
- The key to the development of modern portfolio theory (MPT) is the placing of severely simplifying assumptions on risks. The behavioral content is ignored and only price volatility characterized by the standard deviation or beta is considered. The MPT failed to interpret and prevent the global financial crisis and capital market panic in 2008.
- Yang discovered a family of non-normal distributions and dual-mode market statistics in 1994. His research was later extended to become a new theory - the Capital Market Behavior Theory (CMBT). For the first time in history, the statistical assumptions of MPT are completely removed and so do the limitations. The findings have been extensively validated by real-time market data since 2000 and evolved to the systematic implementation of the Yin-Yang Index as a new scientific indicator of primary market trends.
- The fundamental difference of CMBT vs. MPT is that the new CMBT quantifies the market behavior by sampling and processing order ticks and volume actions directly with a dual-mode non-symmetric statistical model instead of the oversimplified bell-curve normal distribution assumed by MPT.