"I can calculate the motion of heavenly bodies, but not the madness of people."
- Isaac Newton
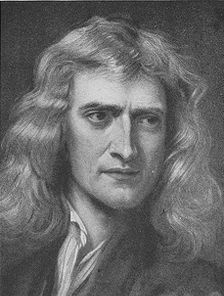
Isaac Newton
|
Synopsis
Isaac Newton (Jan. 4, 1643 - Mar. 31, 1727) is perhaps the greatest physicist who has ever lived. With discoveries in optics, motion and mathematics, Newton developed the principles of modern physics. In 1687, he published his most acclaimed work, Mathematical Principles of Natural Philosophy, which has been called the single most influential book on physics. Newton was a victim of the South Sea Bubble, one of the most famous stock market bubbles in history. The great scientist took a philosophical view of his losses: “I can calculate the motions of the heavenly bodies, but not the madness of the people". | ||
Newton's Three Laws of Motion and His South Sea Bubble Lessons
From 1966 to 1669, Newton made three of his greatest discoveries. In the field of optics, the study of light, he developed and proved his theory that white light is composed of a mixture of other colors of light to form a band of color called a spectrum. This was a revolutionary advance, and equally revolutionary was his work in mathematics, where he developed a binomial theorem and worked out a method of calculating the slope of curves and the area under them, paving the way for the field of math known as calculus. But his most important innovation was the concept of gravity, the attraction between bodies in space that holds planets, moons and comets in orbit, and draws falling objects toward the earth.
He presented a paper detailing his discoveries in optics, and developed a rivalry with the scientist Robert Hooke, who harshly criticized Newton's research. This rivalry would percolate throughout the 1670s, as Newton continued to work out the mathematics of gravity, and would flare up in the mid 1680s, when Newton finally published his work, some of which Hooke felt had been stolen from him. Newton's research was organized into a three-volume book, the Philosophiae Naturalis Principia Mathematica ("Mathematical Principles of Natural Philosophy"), known to posterity as the Principia. It set forth Newton's three laws of motion, and proceeded to set forth the theory of gravitation, and back it up with rigorous mathematical proofs.
For a couple centuries before Einstein, Newton’s Laws were the basic principles of Physics. These laws are still valid and they are the basis for much engineering analysis today. As recently revisited by Dr. Charlie Q. Yang, Newton’s Three Laws can also be applied to understand basic stock market price movements under the context of Capital Market Behavior Theory.
Isaac Newton was one of the smartest people to ever live. But there's a big difference between being a smart physicist and smart investor. In Benjamin Graham's classic "The Intelligent Investor", there is a historical note about Newton's adventures with investing the South Sea Company:
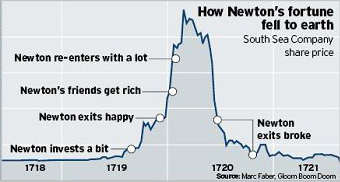
"Back in the spring of 1720, Sir Isaac Newton owned shares in the South Sea Company, the hottest stock in England. Sensing that the market was getting out of hand, the great physicist muttered that he 'could calculate the motions of the heavenly bodies, but not the madness of the people.' Newton dumped his South Sea shares, pocketing a near 100% profit. But just months later, swept up in the wild enthusiasm of the market, Newton jumped back in at a much higher price — and lost most of his money. For the rest of his life, he forbade anyone to speak the words 'South Sea' in his presence." Here's a look at how South Seas bubble happened back then.
He presented a paper detailing his discoveries in optics, and developed a rivalry with the scientist Robert Hooke, who harshly criticized Newton's research. This rivalry would percolate throughout the 1670s, as Newton continued to work out the mathematics of gravity, and would flare up in the mid 1680s, when Newton finally published his work, some of which Hooke felt had been stolen from him. Newton's research was organized into a three-volume book, the Philosophiae Naturalis Principia Mathematica ("Mathematical Principles of Natural Philosophy"), known to posterity as the Principia. It set forth Newton's three laws of motion, and proceeded to set forth the theory of gravitation, and back it up with rigorous mathematical proofs.
For a couple centuries before Einstein, Newton’s Laws were the basic principles of Physics. These laws are still valid and they are the basis for much engineering analysis today. As recently revisited by Dr. Charlie Q. Yang, Newton’s Three Laws can also be applied to understand basic stock market price movements under the context of Capital Market Behavior Theory.
Isaac Newton was one of the smartest people to ever live. But there's a big difference between being a smart physicist and smart investor. In Benjamin Graham's classic "The Intelligent Investor", there is a historical note about Newton's adventures with investing the South Sea Company:
"Back in the spring of 1720, Sir Isaac Newton owned shares in the South Sea Company, the hottest stock in England. Sensing that the market was getting out of hand, the great physicist muttered that he 'could calculate the motions of the heavenly bodies, but not the madness of the people.' Newton dumped his South Sea shares, pocketing a near 100% profit. But just months later, swept up in the wild enthusiasm of the market, Newton jumped back in at a much higher price — and lost most of his money. For the rest of his life, he forbade anyone to speak the words 'South Sea' in his presence." Here's a look at how South Seas bubble happened back then.
Newton invented calculus and conceptualized his three laws of motion. But this little episode shows that as a human, he let his emotions get the best of him, and got swayed by the irrationality of the crowd. Or as Graham described it: "For indeed, the investor's chief problem — and even his worst enemy — is likely to be himself."
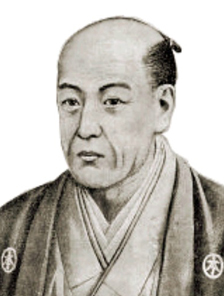
Homma Munehisa
|
Synopsis
Homma Munehisa (1724-1803) was a rice merchant from Sakata, Japan who traded in the rice market in Osaka during his time. He created the candlestick chart as a technical analysis tool used to describe price movements. In 1755, he wrote "The Fountain of Gold - The Three Monkey Record of Money", the first book on market psychology. In this, he claims that the psychological aspect of the market is critical to trading success and that traders' emotions have a significant influence on rice prices. He describes the rotation of Yang (a bull market), and Yin (a bear market) and claims that within each type of market is an instance of the other type. | ||
A Brief History of Candlestick Charts
The principles behind candlestick charting were first developed over 250 years ago by Homma Munehisa, a Japanese businessman who traded rice futures. Homma realized that the rice futures market was strongly influenced by the emotions of the traders. He knew that traders tended to hold on to their positions for as long as the market moved their way. If something happened in the market and the traders lost confidence, they would reverse their positions quickly.
Homma understood that what happened between the open and the close of rice futures was essential to technical interpretation, so he developed a process to reliably track trader confidence and identify trends in the market. These principles, which form the basis of modern candlestick charting, were so successful that Homma became very wealthy and the number of people who
used his principles to trade grew. Over time, Japanese traders found Homma’s principles so useful that he received the title of honorary Samurai.

Today, candlestick charts are one of the most common tools traders use for technical analysis. Most traders prefer to use the candlestick chart because it can help them to:
- Determine the current state of the market at a glance. Just by looking at the color and length of a candlestick, traders can determine instantly if the market is strengthening (becoming bullish) or weakening (becoming bearish).
- See the direction of the market more easily. On a candlestick chart, the color and shape of the candlestick can help traders determine if an uptrend is part of bullish momentum or simply a bearish spike.
- Identify market patterns quickly. Candlestick charts display specific bullish and bearish reversal patterns that cannot be seen on other charts.
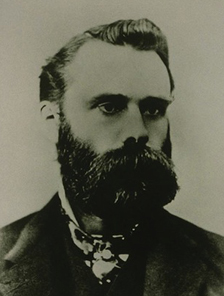
Charles Dow
|
Synopsis
Charles Henry Dow (Nov. 5, 1851 – Dec. 4, 1902) was an American journalist who co-founded The Wall Street Journal in order to present business news in a simple, unbiased way. Dow also invented the famous Dow Jones Industrial Average as part of his research into market movements. He further developed a series of principles and stock averages for understanding and analyzing market behavior which later became known as Dow Theory, serving as the groundwork for technical analysis. His "Dow theory" continues to inform and inspire economists and financial analysts seeking to understand market behavior. | ||
Charles Dow’s Six Secrets to Market Success
With help from William Hamilton, S.A Nelson and Robert Rhea, Dow made a number of observations that are as relevant now as they were in the late nineteenth century. Though these observations have become known as the Dow Theory, they are actually just six common-sense guidelines that investors and traders should treat as the unseen foundations of their decision-making process.
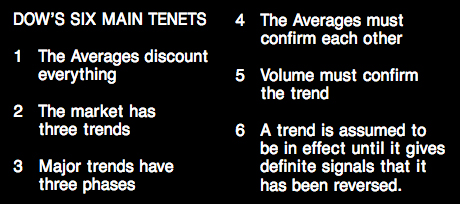
The Averages Discount Everything
Dow’s research was based on the Dow Jones Industrial, Transport and Utility Averages. By focusing on these Averages' price action, technical analysts believe that anything that can affect the market price of a financial instrument is already reflected in its price. This is such an uncomfortable concept to grasp most people would think traditional ‘fundamental’ factors such as the state of the economy, interest rate movements and political considerations should determine supply and demand (and therefore market price).
Technical analysts would simply be looking at the same variables as economists. However, there are more components, and these are what differentiate technical vs. fundamental. All financial markets have one common denominator – they are traded by people, and human psychology and behavior play a huge part in price movement. As well as the economic fundamentals, prices reflect the hopes, fears, expectations, errors and speculation of market participants. By analyzing price, technical analysts are focusing on all known, or expected, influences on supply and demand.
The Market Has Three Trends
Firstly, Dow splits trends into three different time perspectives: long term (major), medium term (secondary or corrective), and short term. The major trend is where profits are readily available, as it is a trend that generally dominates for a year or more. Dips in a major bull trend offer buying opportunities, while recovery attempts in a bear trend offer selling opportunities. These dips or recovery attempts are known as the secondary trend and are smaller waves that flow against the dominant (major) tide. They can be traded successfully, but it must always be remembered that the market will generally return to its major trend.
Major Trends Have Three Phases
By identifying three different phases within a major trend, Dow went deeper than this.
The Averages Must Confirm Each Other
Dow was looking at the Industrial, Utility and Transport Averages in the US, and believed that all three had to be moving in the same direction to give ultimate confidence in the longer-term direction of the market. If all three were making new lows, the market was inherently bearish and was likely to move lower still. If they gave conflicting signals, it suggested that investors should stay on the sidelines until they re-aligned. This is still a useful practice in the modern world. If the Dow Jones hits a new low, what is happening to the S&P500 and the NASDAQ?
Volume Must Confirm the Trend
If the major trend is bullish, volume should increase as prices head higher. Volume should also lighten during secondary corrective waves. If volume steadily declines during a bull trend, it should set alarm bells ringing, as there is a genuine risk that the rally is running out of steam.
A Trend Remains Effective Until Reversed
According to Dow Theory, a trend is assumed to be in effect until it gives definite signals that it has been reversed. Dow may have gained inspiration from Isaac Newton’s law, expressed in Principia Mathematica, that argues that “a body in motion will continue in the same direction until it shows signs of reversing or slowing.” Charles Dow’s Theory was not designed to pick out tops and bottoms as they develop. Instead, its goal was to identify a major trend reversal, and ride the subsequent wave higher until confirmation was given that it had ended.
The Dow's six principles left the bigger question unanswered: when does a secondary trend become so strong that it negates the major trend and becomes a new major trend itself? This question led that for over 100 years after Dow, technical analysts are constantly searching for technical indicators to monitor price patterns, retracing levels, moving averages, trend-lines, volume, and momentum oscillators. These efforts hope to find accurate and effective tools to determine the critical point at which a major trend will reverse. By identifying this threshold, risks become controllable, therefore minimizing losses from an incorrect decision.
Dow’s research was based on the Dow Jones Industrial, Transport and Utility Averages. By focusing on these Averages' price action, technical analysts believe that anything that can affect the market price of a financial instrument is already reflected in its price. This is such an uncomfortable concept to grasp most people would think traditional ‘fundamental’ factors such as the state of the economy, interest rate movements and political considerations should determine supply and demand (and therefore market price).
Technical analysts would simply be looking at the same variables as economists. However, there are more components, and these are what differentiate technical vs. fundamental. All financial markets have one common denominator – they are traded by people, and human psychology and behavior play a huge part in price movement. As well as the economic fundamentals, prices reflect the hopes, fears, expectations, errors and speculation of market participants. By analyzing price, technical analysts are focusing on all known, or expected, influences on supply and demand.
The Market Has Three Trends
Firstly, Dow splits trends into three different time perspectives: long term (major), medium term (secondary or corrective), and short term. The major trend is where profits are readily available, as it is a trend that generally dominates for a year or more. Dips in a major bull trend offer buying opportunities, while recovery attempts in a bear trend offer selling opportunities. These dips or recovery attempts are known as the secondary trend and are smaller waves that flow against the dominant (major) tide. They can be traded successfully, but it must always be remembered that the market will generally return to its major trend.
Major Trends Have Three Phases
By identifying three different phases within a major trend, Dow went deeper than this.
- A new major bull trend actually begins before the preceding bear trend has ended. At this point, economic news and data is still bearish, but importantly this has already been priced in and discounted by the market. It is at this stage that the smart money begins to buy, creating a secondary wave higher. Sellers still believe that they possess overall control, but subsequent dips fail to reach a new low and a basing pattern develops. This is called the accumulation phase.
- The second phase of a major bull trend is the strongest and longest. The basing pattern is completed and sellers, realizing their mistake, are forced to cover or reverse their short positions. It is at this point that Dow would enter the market on the long side, sacrificing the uncertainty of the turning point for (lower risk) longer-term gains.
- For the third and final phase, the market continues to rise as increasingly optimistic news stories are priced in. As with the final phase of the bull trend, everybody wants a piece of the action and the public begin to participate. However, during this climactic final phase, the smart money is already beginning to lock in profits by selling. At this point all the good news is priced in, fresh buying is merely based on speculation, the market is heavily overvalued.
The Averages Must Confirm Each Other
Dow was looking at the Industrial, Utility and Transport Averages in the US, and believed that all three had to be moving in the same direction to give ultimate confidence in the longer-term direction of the market. If all three were making new lows, the market was inherently bearish and was likely to move lower still. If they gave conflicting signals, it suggested that investors should stay on the sidelines until they re-aligned. This is still a useful practice in the modern world. If the Dow Jones hits a new low, what is happening to the S&P500 and the NASDAQ?
Volume Must Confirm the Trend
If the major trend is bullish, volume should increase as prices head higher. Volume should also lighten during secondary corrective waves. If volume steadily declines during a bull trend, it should set alarm bells ringing, as there is a genuine risk that the rally is running out of steam.
A Trend Remains Effective Until Reversed
According to Dow Theory, a trend is assumed to be in effect until it gives definite signals that it has been reversed. Dow may have gained inspiration from Isaac Newton’s law, expressed in Principia Mathematica, that argues that “a body in motion will continue in the same direction until it shows signs of reversing or slowing.” Charles Dow’s Theory was not designed to pick out tops and bottoms as they develop. Instead, its goal was to identify a major trend reversal, and ride the subsequent wave higher until confirmation was given that it had ended.
The Dow's six principles left the bigger question unanswered: when does a secondary trend become so strong that it negates the major trend and becomes a new major trend itself? This question led that for over 100 years after Dow, technical analysts are constantly searching for technical indicators to monitor price patterns, retracing levels, moving averages, trend-lines, volume, and momentum oscillators. These efforts hope to find accurate and effective tools to determine the critical point at which a major trend will reverse. By identifying this threshold, risks become controllable, therefore minimizing losses from an incorrect decision.